Google Maps heatmap: Dogs
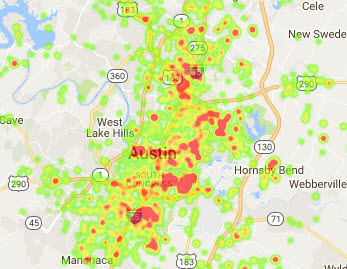
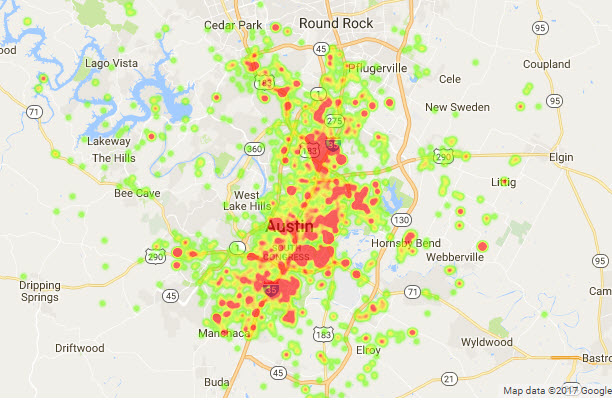
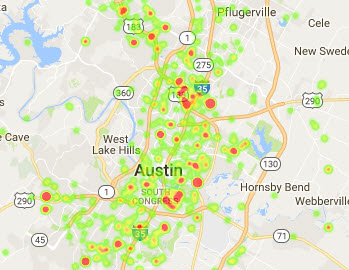
Frequency of dog intakes was most dense around the downtown area, and near the I-35 corridor.
Visualizations
.jpg)
Frequency of dog intakes was most dense around the downtown area, and near the I-35 corridor.